


| |
Nasdaq 1002 | S&P 5002 | |
|---|---|---|---|
| March 20201 | 5.00% | -8.40% | -12.92% |
| 2Q 2020 | 36.95% | 29.99% | 20.54% |
| 3Q 2020 | 20.34% | 12.42% | 8.93% |
| 4Q 2020 | 18.42% | 12.88% | 12.15% |
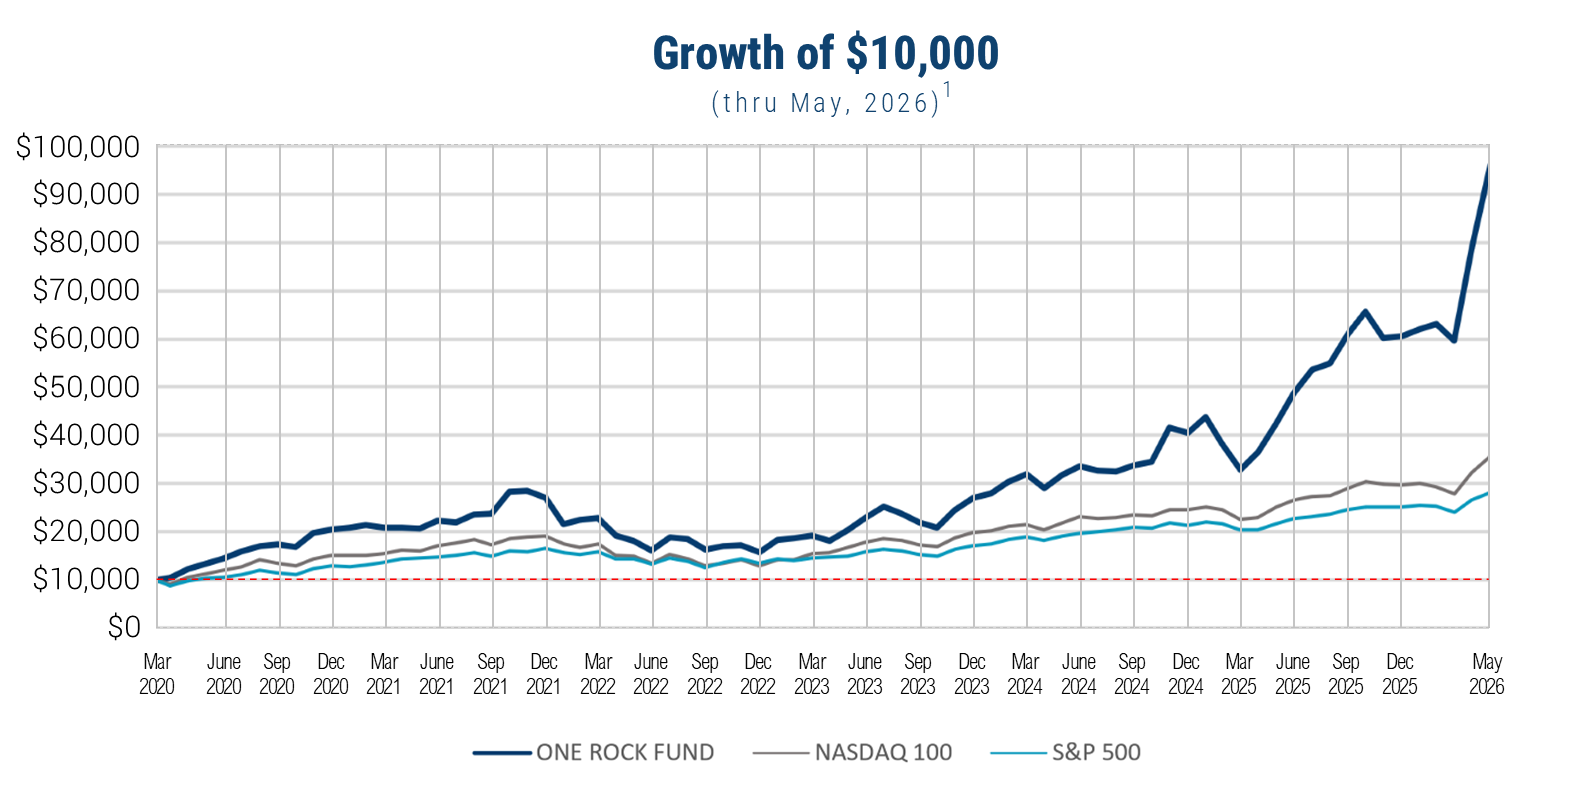
| 20201 | 104.93% | 51.09% | 28.24% |
| 1Q 2021 | 1.87% | 1.58% | 6.17% |
| 2Q 2021 | 6.76% | 11.18% | 8.55% |
| 3Q 2021 | 6.62% | 0.92% | 0.58% |
| 4Q 2021 | 13.41% | 11.10% | 11.03% |
| 2021 | 31.52% | 26.63% | 28.71% |
| 1Q 2022 | -15.14% | -9.08% | -4.60% |
| 2Q 2022 | -30.10% | -22.47% | -16.10% |
| 3Q 2022 | 1.32% | -4.63% | -4.88% |
| 4Q 2022 | -3.56% | -0.29% | 7.56% |
| 2022 | -42.04% | -32.97% | -18.11% |
| 1Q 2023 | 22.93% | 20.49% | 7.50% |
| 2Q 2023 | 19.05% | 15.16% | 8.74% |
| 3Q 2023 | -3.83% | -3.06% | -3.27% |
| 4Q 2023 | 22.50% | 14.34% | 11.69% |
| 2023 | 72.41% | 53.81% | 26.29% |
| 1Q 2024 | 18.54% | 8.49% | 10.56% |
| 2Q 2024 | 5.42% | 7.82% | 4.28% |
| 3Q 2024 | 0.30% | 1.92% | 5.89% |
| 4Q 2024 | 20.02% | 4.74% | 2.41% |
| 2024 | 50.42% | 24.88% | 25.02% |
| 1Q 2025 | -19.03% | -8.25% | -4.27% |
| 2Q 2025 | 48.38% | 17.64% | 10.94% |
| 3Q 2025 | 25.03% | 8.82% | 8.12% |
| 4Q 2025 | -0.62% | 2.31% | 2.65% |
| 2025 | 49.28% | 20.17% | 17.88% |
| 1Q 2026 | -1.48% | -5.98% | -4.33% |
| April 2026 | 32.56% | 15.64% | 10.49% |
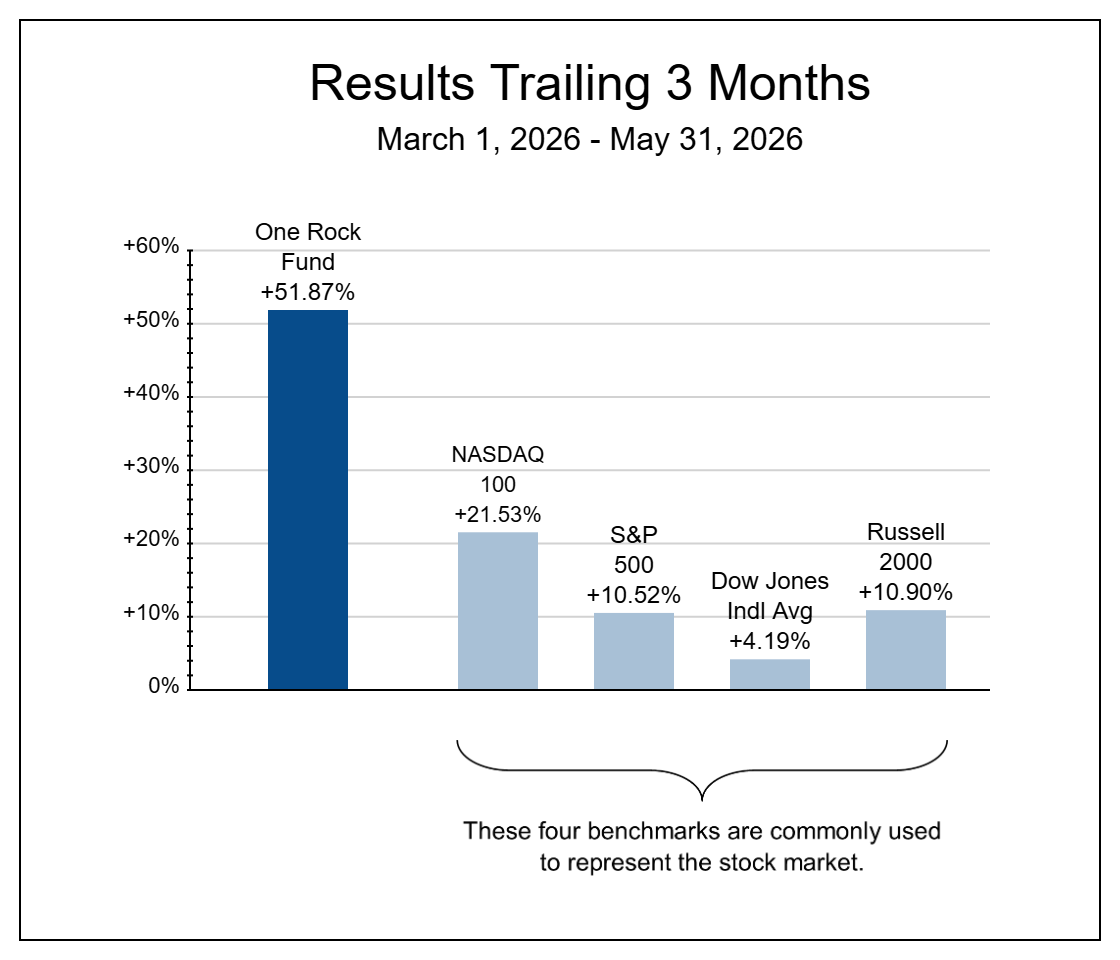
| May 2026 | 21.53% | 10.49% | 5.26% |
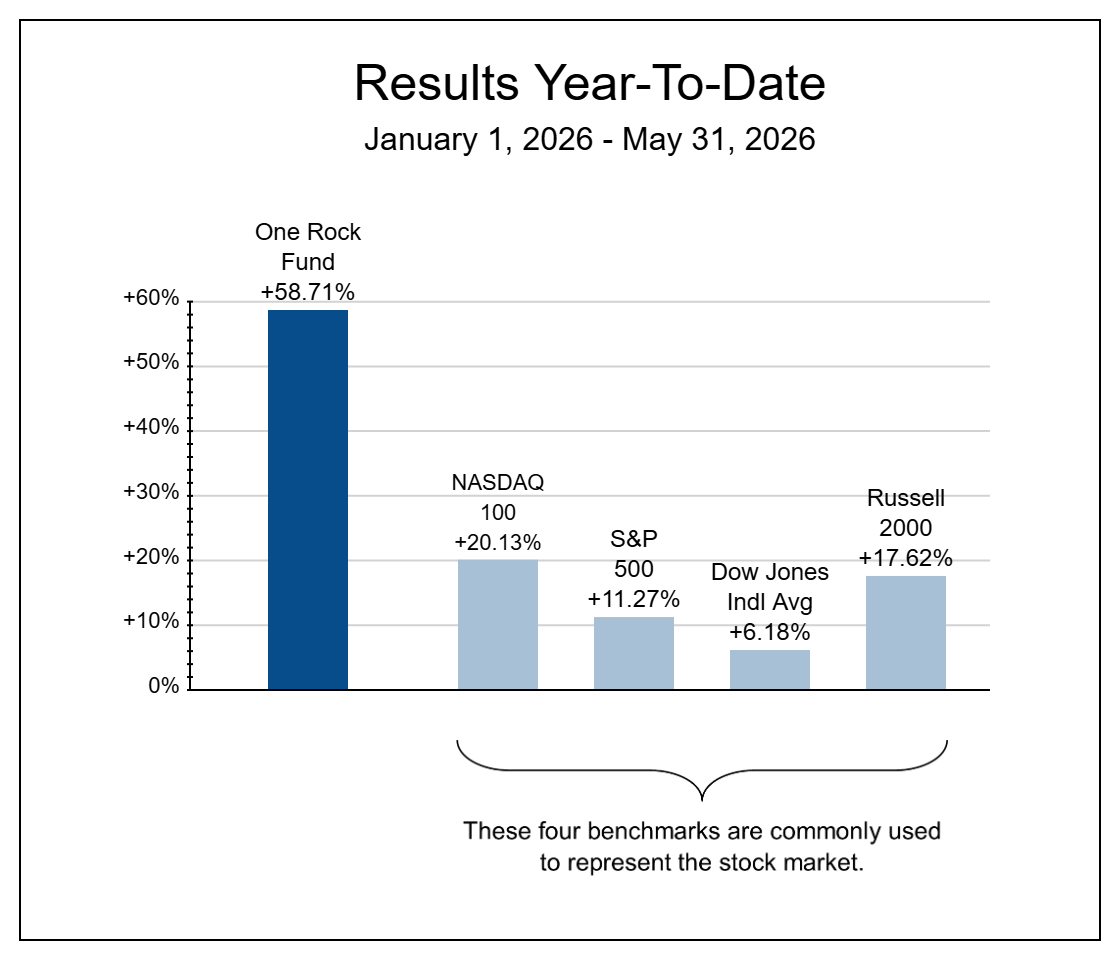
| 2026 YTD | 58.71% | 20.13% | 11.27% |
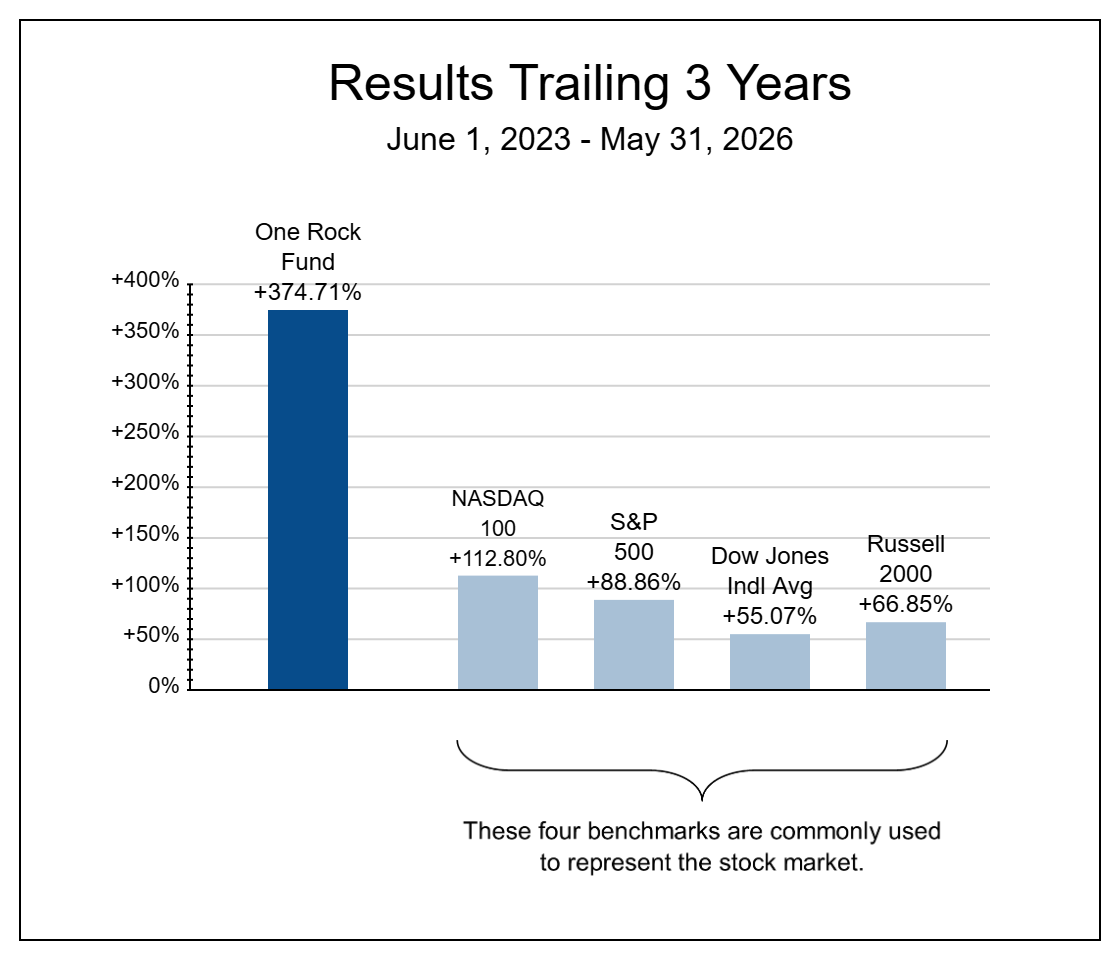
| Last 3 Years Annualized |
374.71% 68.06% |
112.80% 28.63% |
88.86% 23.61% |
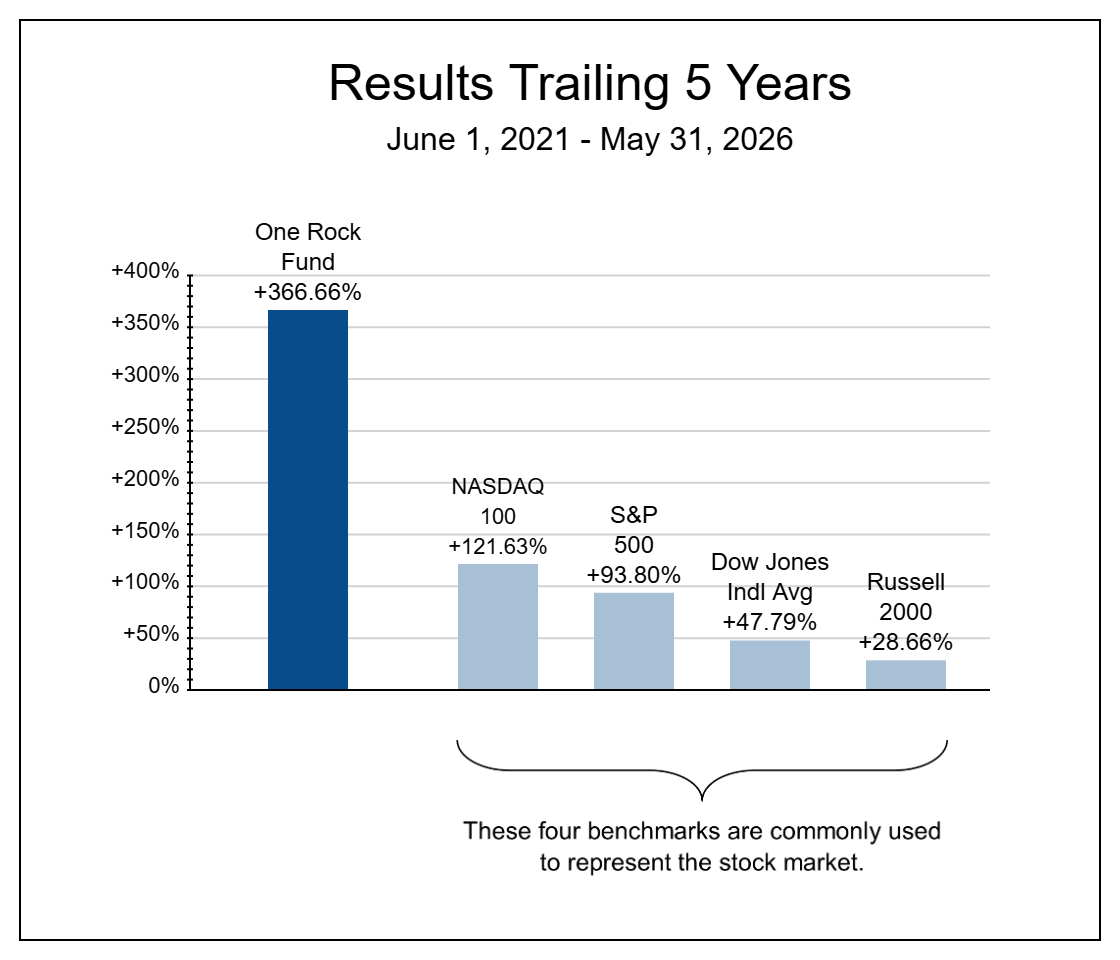
| Last 5 Years Annualized |
366.66% 36.08% |
121.63% 17.25% |
93.80% 14.15% |
| Since Inception Annualized |
859.90% 43.74% |
255.59% 22.57% |
179.89% 17.95% |

